Apply now to join our next cohort of Community Science Fellows and Community Leads!

The City of San Diego has a population of 1.4 million, making it the eighth-largest city in the United States. It is an incredibly diverse population with nearly 41% of the population speaking a language other than English at home. The city is currently in the process of developing a Climate Adaptation and Resiliency Plan to reduce vulnerability to projected climate changes. They are working collaboratively with stakeholders and community members on its development. One major challenge they are planning for is increased heat. Like many other large urban areas, San Diego has seen an increase in heat-related hospitalizations and morbidity in response to hot-weather episodes. This impact has been especially prominent along the coast where residents may not have air conditioning or be acclimated to the heat. This is explored in Guirguis et al., 2018 where Heat, Disparities, and Health Outcomes in San Diego County’s Diverse Climate Zones are discussed.
City Planners currently use geospatial layers such as tree canopy, landcover, and urban heat to make policy and management decisions. However, the scale of these products is too coarse to make location specific climate-adaptation decisions. They would like to further explore the feasibility of determining vulnerability at the block-scale. The planners also recognize the potential to incorporate new datasets into evaluating heat vulnerability and are interested in investigating available datasets further.
The San Diego Planning Department sees two main objectives for this Thriving Earth Exchange project. The first is to identify social and environmental vulnerability variables that drive heat vulnerability and collect associated datasets. This would include a summary of dataset scales and ranking of variable importance. The second is to identify a methodology that combines the drivers to create a new heat vulnerability index, preferably at the block-scale. Geospatial layers derived from this project will potentially be incorporated in a future app that would allow residents to search heat vulnerability in their area. The outputs will also be utilized when evaluating appropriate climate adaptation strategies for certain areas.
Project Outputs:
The collaboration between the community and the scientist(s) should start as soon as possible. The duration of the project will be approximately 6 months. Key milestones include: 1) review of literature and available data products, 2) methodology proposal, 3) index creation, and 4) handoff of project products.
 Julia Chase
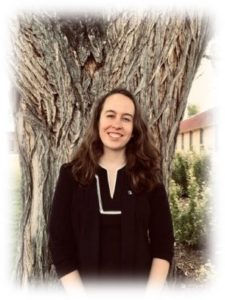
The scientist will work with Julia Chase, Senior Planner for the City of San Diego. She is a project manager for the City of San Diego’s climate adaptation and resilience planning initiatives. She will provide insight on the cities current process of evaluating heat vulnerability and feedback on index development. She has provided a list of current datasets used to determine heat vulnerability.
Julia Chase is a Senior Planner with the City of San Diego’s Planning Department leading the City’s climate adaptation and resiliency work program. She has led the efforts to complete the City’s Sea Level Rise Vulnerability Assessment and the Citywide Multi-hazard Climate Change Vulnerability Assessment and is currently leading the development of Climate Resilient SD, the City’s comprehensive climate adaptation plan.

Kristen O’Shea
Kristen O’Shea works as a Center Lead and Geoinformatics Fellow for the NASA DEVELOP program. She manages two research teams of recent graduates/early career professionals at the program’s Colorado location. She oversees their work on remote sensing feasibility projects that help inform policy and management decisions for an array of partners both domestic and international. She also utilizes her skillset in coding, remote sensing, GIS, spatial modeling, and spatial analysis to support all 11 locations in their geoinformatics needs.
(c) 2025 Thriving Earth Exchange