
By Nancy D. Lamontagne
Like many areas, western Kentucky suffers periods of drought, making it essential that water resources are managed efficiently during both normal and drought conditions. However, water managers are often faced with making decisions about water restrictions based on rainfall measurements taken several counties away, making it difficult to decide where water restrictions are truly needed and avoid overly constraining water use in places where rainfall has been sufficient.
A Thriving Earth Exchange (TEX) project helped solve this problem by connecting water managers in the Barren River Area Development District (BRADD) of western Kentucky with scientists from the Kentucky Climate Center at the Western Kentucky University. Covering ten counties in western Kentucky, BRADD plays a crucial role in water and wastewater resource management and planning for the region.
The project produced a series of easy-to-use online tools that provide local water planners with detailed, localized data they can use to monitor water availability, make decisions about water restrictions and identify drought in their areas. Explore the project and its outcomes in our interactive slideshow.
Kentucky Mesonet

Since 2007, the Kentucky Climate Center at the Western Kentucky University has been building the Kentucky Mesonet, a network of 66 automated and research grade weather and climate monitoring stations in 65 counties. When TEX connected BRADD with the Climate Center, the water managers were excited about this new data source because it could provide regularly updated precipitation information collected very close to where they work. To make this data useful for BRADD water managers, a team of Kentucky Climate Center researchers led by Associate Director Rezaul Mahmood, Ph.D., packaged it into user-friendly online decision support tools.
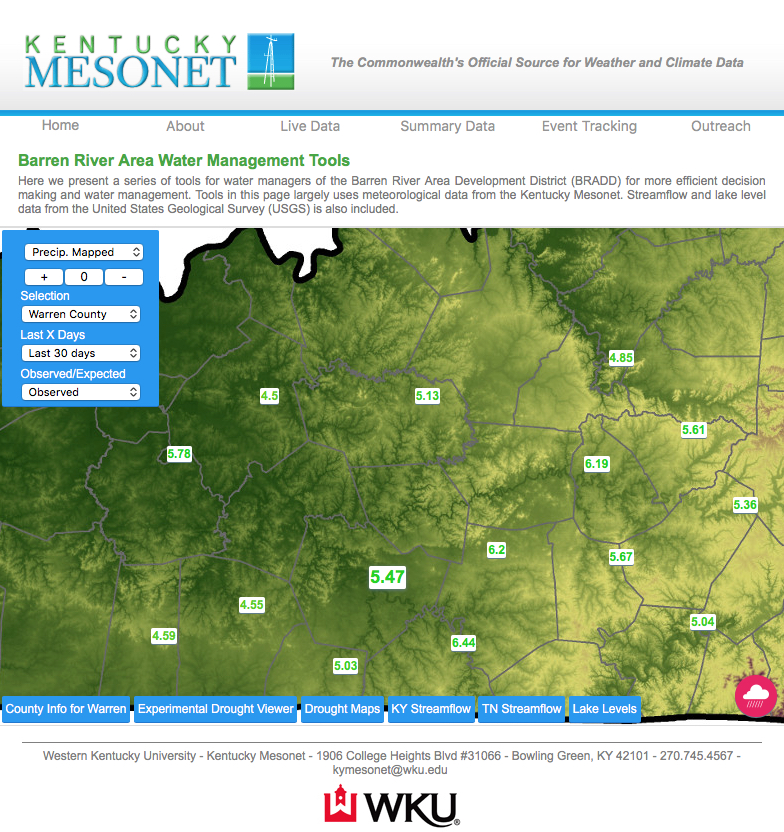
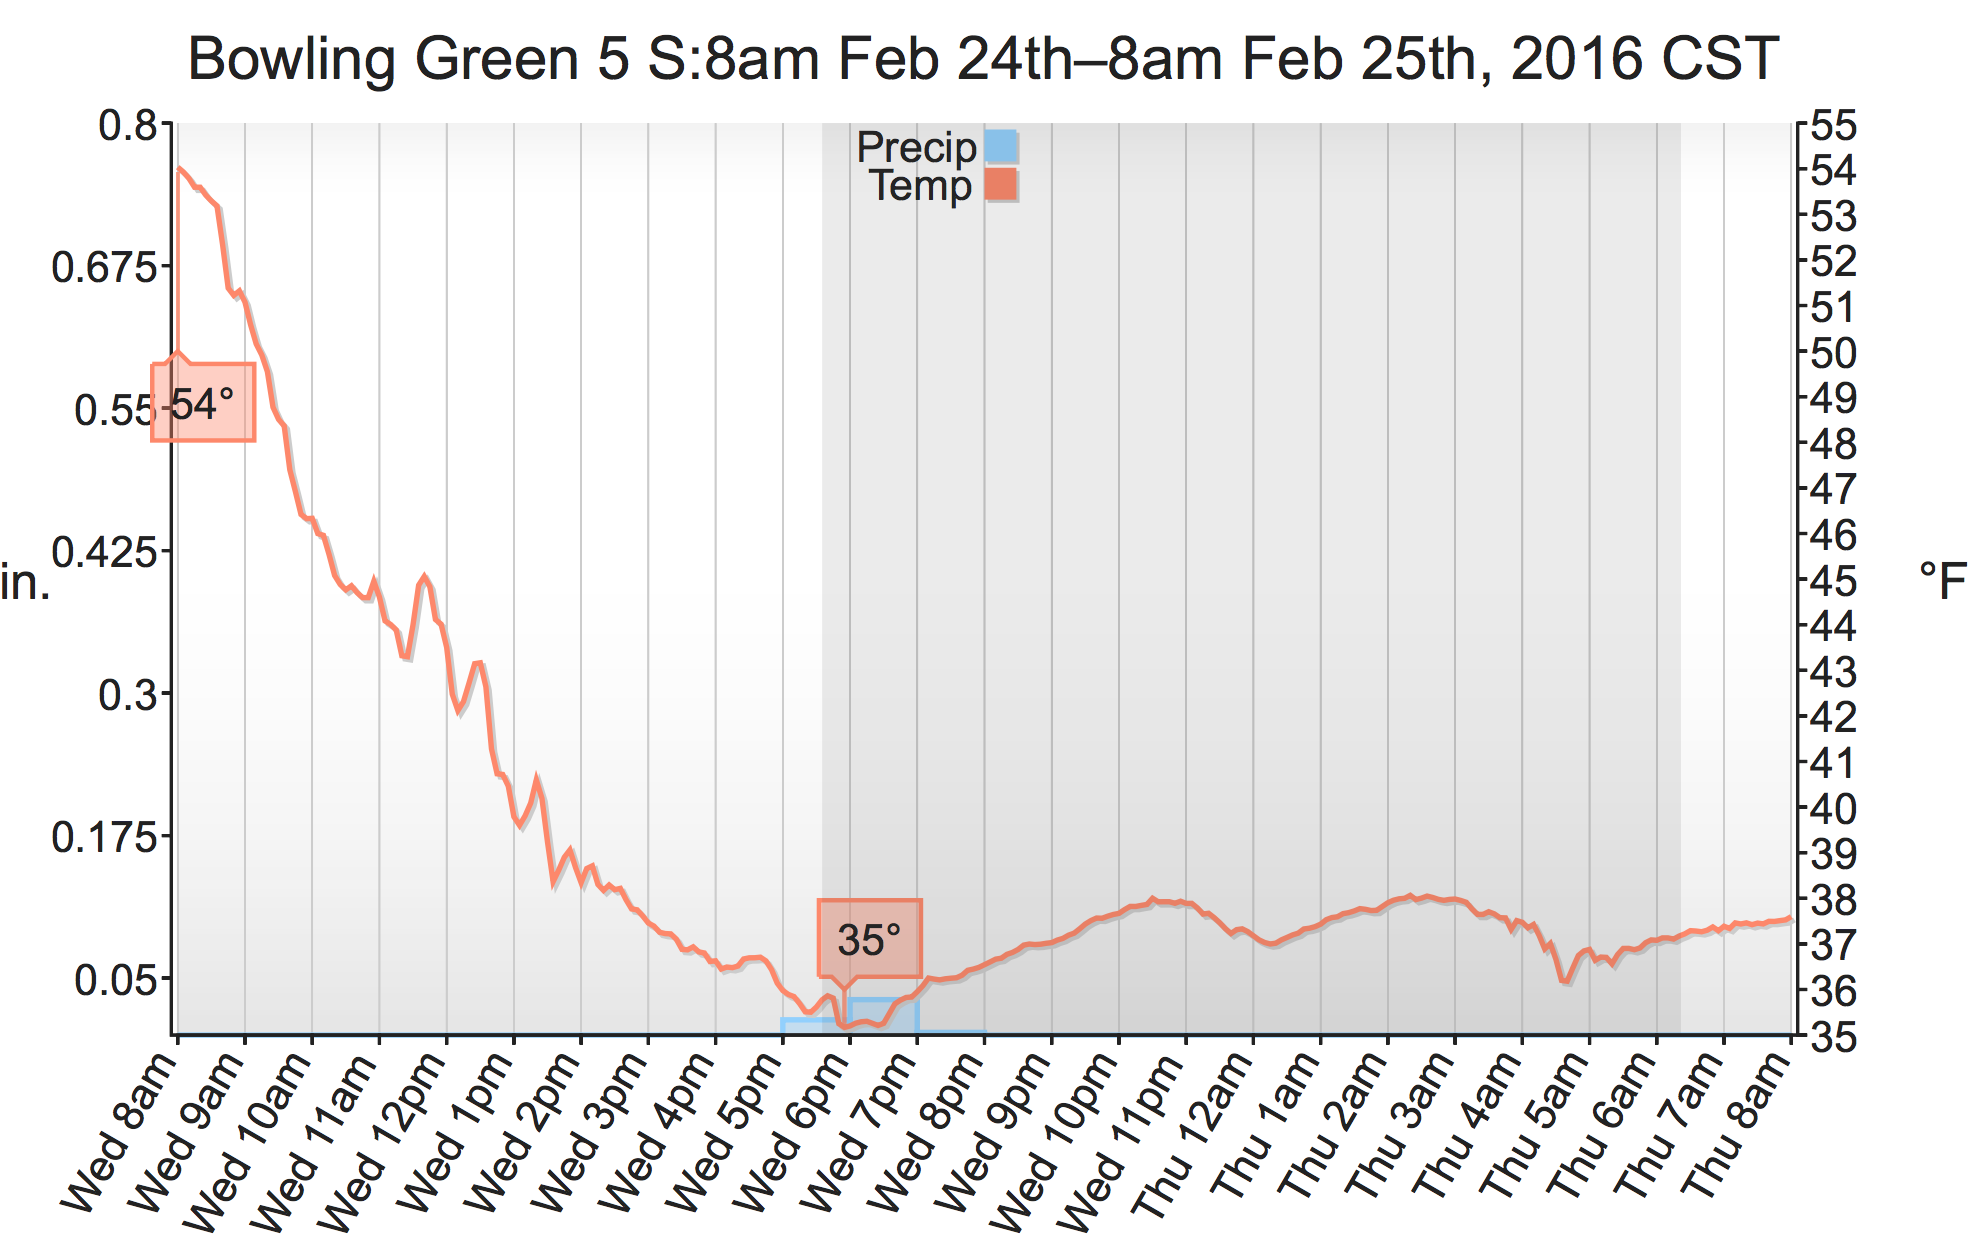
Water managers can also use the tool to see a map of precipitation in the BRADD region (left). Selecting a county and then clicking the cloud icon in the lower right of the screen brings up detailed 24-hour information for that area (graph on right). Moving forward, the Kentucky Climate Center researchers would like to expand the tools as needs changes and new data becomes available. They are also trying to secure funding to work with water managers from other regions in the state so that the tools can be expanded across Kentucky.