Guest Blog – The Tool for Climate Explorers
by Ned Gardiner and Fred Lipschultz
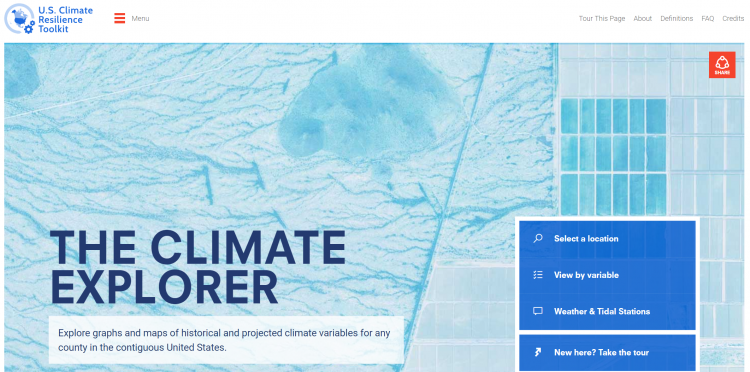
Gone are the days when one needed a degree in computer science to understand climate history, projections and impacts. Since its launch, the U.S. Climate Resilience Toolkit (CRT) has provided information about changing climate-related risks alongside tools one can use to address those risks. Its newly updated Climate Explorer tool (Figure 1) makes it easy for anyone— scientist, city manager or concerned citizen alike—to understand climate. The Climate Explorer integrates data from weather stations[1] and tide gages,[2] gridded observations,[3] and downscaled climate projections[4] taken from the same dataset used widely within the 4th National Climate Assessment. The tool delivers visualizations and raw data so people can assess their own exposure to climate stressors and climate-related hazards for every county in the United States’ lower 48 states.
According to EcoAdapt’s Lara Hansen, the Climate Explorer has filled in knowledge gaps for communities to take action, for example simplifying a climate assessment and planning activity that spans six municipalities, some of which have internal climate analysis capacity and some that don’t.
In most locations there is not customized local climate data to inform decision-making. Only large cities, such as New York, or data-rich regions, such as California or the Puget Sound region of Washington State, have the resources to create their own climate data. Prior to the Climate Resilience Toolkit and the Climate Explorer, every other region was at a loss for where to go. Conducting comparisons between sites was a major undertaking. – Lara Hansen, EcoAdapt Executive Director and Chief Scientist

Hansen and Ecoadapt further “… realized that the CRT’s Climate Explorer could provide the basic information any community would need to develop a climate-savvy plan.” EcoAdapt intends to use Climate Explorer to help a small community in Mississippi incorporate climate information into its comprehensive plan, which itself hasn’t been updated in some 30 years. Eight more communities—all part of an NSF-funded informal science education grant—are next in EcoAdapt’s queue. Having a consistent tool and set of data to draw upon for county-level information makes this work possible.
Community leaders themselves are also using the toolkit and the Climate Explorer. The city of Blacksburg, Virginia followed its 2016 Climate Action Plan with a Climate Vulnerability Assessment. Browsing the U.S. Climate Resilience Toolkit, Sustainability Manager Carol Davis found authoritative references about her region’s climate trends, major climate indices and indicators, and energy demand during heating and cooling seasons. Because the Climate Explorer tool provides presentation-ready graphics, she was able to easily assemble a 31-page slide presentation featuring 22 separate graphs and maps taken directly from the tool and annotated with key takeaways (Figures 2 and 3). She considered the differing risks of two emissions scenarios (RCP 4.5 and RCP 8.5[1]) and two time horizons (mid and late-21st century).

Her constituents are particularly concerned with agricultural yields given the region’s economic productivity in this sector, food security on a national level, and forest health due to shifting conditions for pests, insects and diseases. Given that Blacksburg’s climate change outlook is buffered by topography community members are also anticipating internal migration of U.S. citizens to Blacksburg over the coming decades. The Climate Explorer helped Davis make clear to her community the importance of getting even more insight and knowledge of the potential impacts of climate change on their economy and culture.
The Climate Resilience Toolkit and its bespoke tool, the Climate Explorer, provide access to essential climate data that underlie the National Climate Assessment and are used across the nation to better respond to the implications of a changing climate. The tool is ready and waiting for you to conduct your own local analysis to support education, outreach, research and decision support. Contact the project team ([email protected]) if you’d like to share your experience, questions or suggestions.
Ned Gardiner, PhD, is a contractor to NOAA’s Climate Program Office.
Fred Lipschultz, PhD, is the Regional Coordinator and Senior Scientist at USGCRP