Keeping it local: New online tools let water managers more accurately gauge drought
By Nancy D. Lamontagne
Like many areas, western Kentucky suffers periods of drought, making it essential that water resources are managed efficiently during both normal and drought conditions. However, water managers are often faced with making decisions about water restrictions based on rainfall measurements taken several counties away, making it difficult to decide where water restrictions are truly needed and avoid overly constraining water use in places where rainfall has been sufficient.
A Thriving Earth Exchange (TEX) project helped solve this problem by connecting water managers in the Barren River Area Development District (BRADD) of western Kentucky with scientists from the Kentucky Climate Center at the Western Kentucky University. Covering ten counties in western Kentucky, BRADD plays a crucial role in water and wastewater resource management and planning for the region.
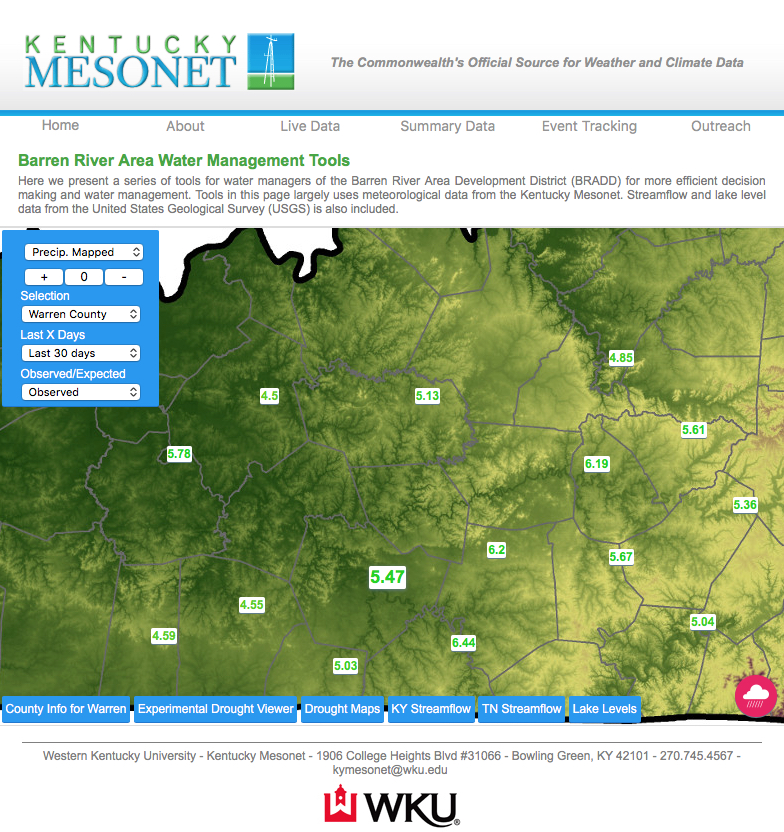
The project produced a series of easy-to-use online tools that provide local water planners with detailed, localized data they can use to monitor water availability, make decisions about water restrictions and identify drought in their areas. Explore the project and its outcomes in our interactive slideshow.
Stream Flow and Lake Level Data

In response to requests from the water managers, stream flow and lake level data from the U.S. Geological Survey was added to the water management tools. “Stream flow and lake levels are critical for us to monitor, especially during dry periods,” said John Dix, general manager of Warren, Butler and Simpson County Water Districts. “The water management tools provide us with the ability to have one site where we can monitor stream flows and lake levels during drought conditions.”